


You’d Expect Lake Area Business Stats To Indicate The Beginnings
Of A Boom. And For The Most Part, They Do Just That.
By Brad Goins
While it’s a bit difficult and unorthodox to try to sum up a year of area business before fourth quarter results are in, Lagniappe’s Business and Industry Round-up takes place when it does, and as a result, fearless journalists such as myself must venture into mysterious lands of business speculation where angels fear to tread.
There is one positive to doing this sort of round-up story without fourth quarter results: one doesn’t have to take into account the inevitable bumps and dips that occur during peak Christmas shopping season in December and the scaling back in sales and employment that takes place right after that season.
In 2015, we have more incentive than usual to take a somewhat early look back at our business year. We’re looking for signs that the story of the decade — the great SWLA boom — is having an effect on local business. While the overall statistics for the first three quarters of 2015 could just be indicative of a strong business year, they are the sorts of statistics we’d expect to see with the arrival of the early stages of a boom.
TOTAL SALES
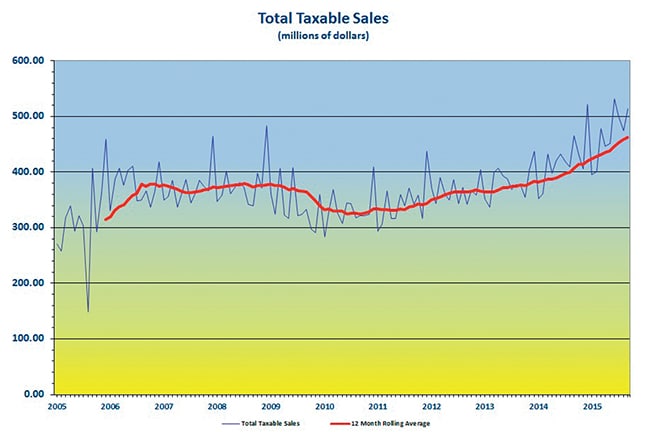
Take away the holiday factor, though, and all monthly sales totals in 2015 were an improvement over those in 2014. And 2014 had been a year of steady sales increases.
All economic figures for the area indicate that something big happened in Spring and Summer of 2015. It might have been a surge in creation of new housing in anticipation of the boom or it might have been an uptick in creation of new infrastructure for Sasol and LNG projects.
You can see the Spring splurge in the sales total for June — $532 million, which was by far the biggest 2015 total through September.
BUILDING MATERIALS SALES
If these big totals were largely due to some sort of big increase in building, we’d expect the numbers to reflect that. They do.
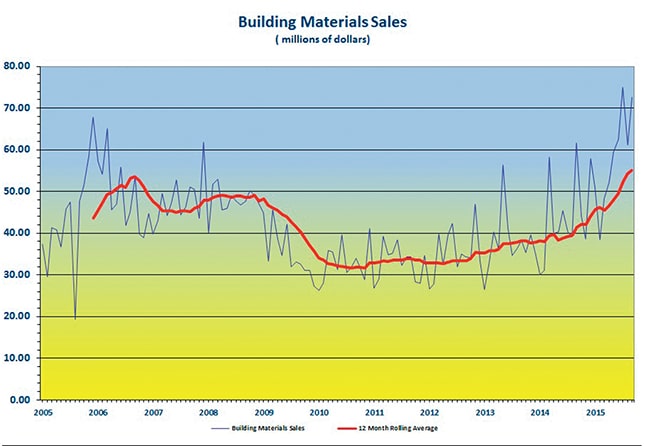
But weather surely didn’t account for the soaring rise to $75 million in building material sales in the scorching heat of July. That number is a mere $1 million away from a 100 percent increase in five months. You need an extraordinary explanation for an extraordinary climb like that — and the sort of rapid increases in construction necessitated by a boom would work.
More impressive evidence of a boom was found in the September building materials sales total, which fell just $1.5 million short of July’s impressive peak number.
FOOD SALES
What indicators would be expected if there’d been an influx of new laborers into the area? Well, we’d expect markedly increased food sales for one thing.
We had them in 2015.
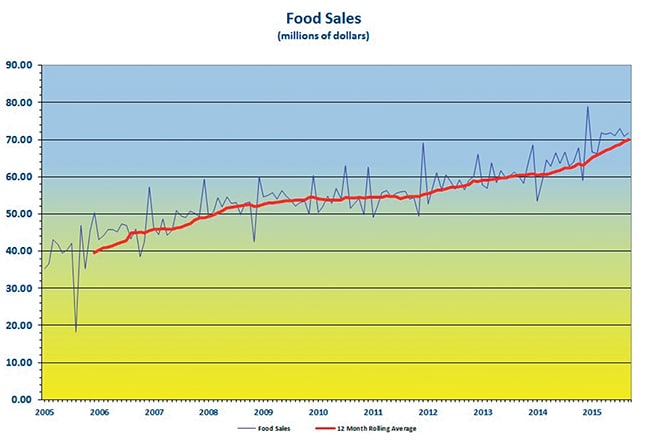
If the figure of $70 million in particular doesn’t mean anything to you, look at the chart for food sales. You’ll notice that while there’s been a steady climb in food sales in the metro area for years, by far the steepest trajectory has been in late 2014 and the first three quarters of 2015. It’s hard not to conclude that at least a certain number of newcomers were moving into the Lake Area and buying the food they had to have right here.
The only area sales figures I can find that were somewhat discouraging in 2015 were those that indicated a fairly large dip in furniture sales going into the fourth quarter. While that certainly isn’t good news, it could be easily explained if one conjectures that the focus of real estate business in the area had shifted to the building and renovation of rental properties and away from the usual intense concentration on the sale and furnishing of homes.
I don’t mean that real estate agents were somehow slacking off when it came to home sales; not at all. I just suggest that those in the real estate business who focus on rental properties were getting motivated and were kicking their business activities into high gear in the Spring and Summer. (And remember, that’s just my hypothesis. I only propose it because I think such a development might explain business stats that would otherwise seem unusual for the area’s business climate.)
UNEMPLOYMENT RATE
Now we turn to labor. After all, if we’re experiencing a boom, at some point we’ll be looking for a significant influx of workers. Many who are exercised by area traffic feel they are already seeing such an influx. And the Lake Charles Police Dept. has traffic figures that will certainly lend strength to their position.
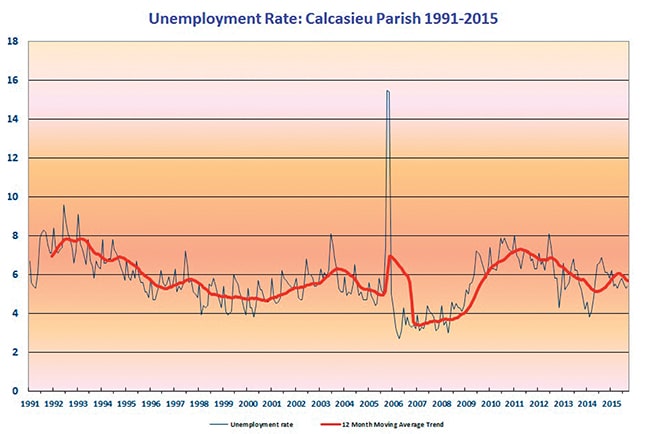
In September, the Lake Area’s unemployment was down to 5.4 percent. Unless there was a fairly big drop in recent weeks, that would put the Lake Area behind the national rate. And the Lake Area has tended to compare favorably with the rest of the country in unemployment rate since the 2008 crash.
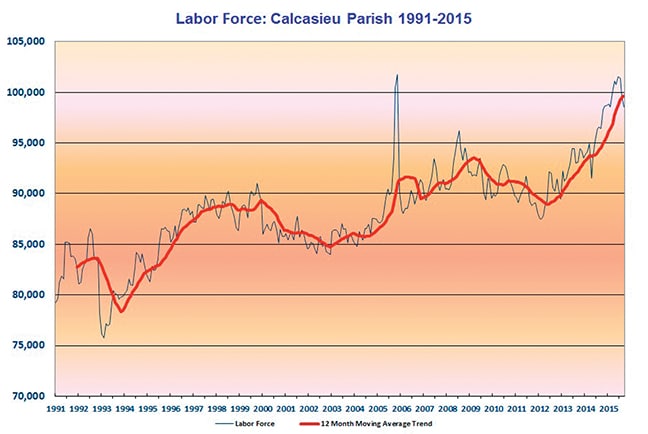
THE LABOR FORCE
The area’s labor force numbers reflected those of the unemployment rate pretty closely. Between April and July, the labor force in the Greater Lake Charles Metro Area surpassed 101,000.
But by September, the force sat almost where it had in October of 2014 (98,553 versus 98,260).
These labor numbers aren’t exactly booming. If the boom will be what we’re told it will be, we’ll expect to start hearing about labor shortages in the not-too-distant future.
Still nothing in the labor picture indicates that there can’t be a boom. If the numbers showed big drops, that would be a real indictment of the boom notion. But the drops we’re talking about here are small ones. They might have more to do with certain types of workers laying the groundwork of new projects, then making way for a larger, somewhat less specialized, workforce that will take the projects into the next stages.
In short, the stage of the use of a large unskilled, or relatively unskilled, labor force, may not yet have been reached.
On the whole, signs are still go for a boom. If the boom really is here, look for 2016 to show a major increase on the already impressive area business numbers of 2015.


Comments are closed.