


According to President Trump, we are in the midst of a tremendous economic expansion that “in many ways [makes this] the greatest economy in the HISTORY of America.” There is no question that investment has soared after Congress cut the corporate tax rate from 35 percent to 21 percent and we currently have record low unemployment. But is this economic performance sustainable?
The president’s economic team claims that gross domestic product (GDP) will be growing at a rate of 5 percent or more by the end of the year. But there are growing indications the economy may be headed in the opposite direction.
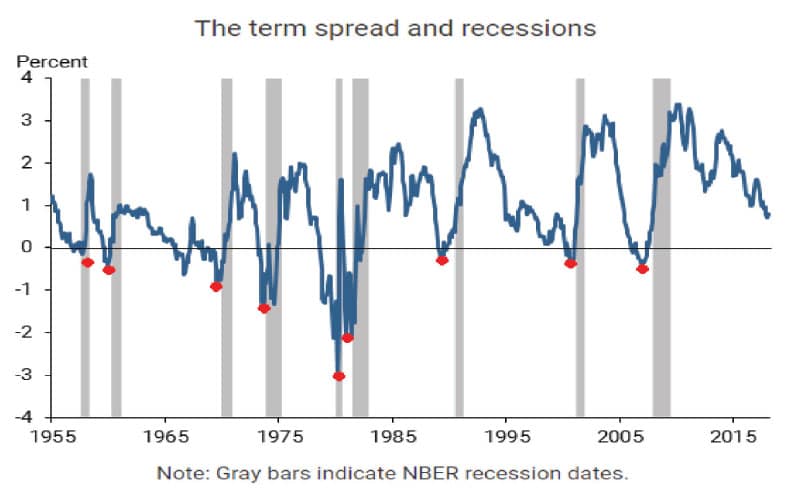
The most recent warning sign of an impending recession is the flattening of the yield curve. The yield curve measures the difference between short-term and long-term interest rates. The reason we should pay attention to it is that it has predicted every recession for the last 60 years.
The yield curve is normally upward sloping, which means long-term interest rates are higher than the short-term rates. This is because lenders and investors generally consider long-term loans to be riskier than short-term loans, so they require higher interest to compensate them for the additional risk.
When the yield curve turns negative — referred to as an “inverted” yield curve — it means that short-term interest rates are higher than long-term rates, suggesting that lenders and investors consider the short-term riskier than the long-term. This has happened 10 times since 1955, and 9 of those times it was followed by a recession within about a year. (See the figure above.)
The one time it wasn’t followed by a recession was 1966, when it was followed by weak growth that was technically not a recession.
Currently, the yield curve is still positive, but it has been steadily getting flatter. The differential between the short- and long-term rates is now just .32 percent, compared to a normal spread of around 2 to 2.5 percent.
One explanation is that the stock market had a significant surge after Donald Trump was elected president. During his first year in office, the Dow Jones Index went from 18,259 to 26,392 — an increase of nearly 50 percent. But it then shed 2,500 points in two weeks. And it’s been bouncing around the 24,000 point level ever since.
One explanation is that investors are getting spooked by uncertainty over trade wars and other Trump policies. (The Cboe stock market volatility index averaged 11.85 in 2017, but so far this year it is averaging 16.94.) Also, many investors are “baby boomers” who are either retired or nearing retirement age, and following the big market rally, they are more interested in preserving their stock market gains than taking additional risks to make even more money.
From a broader perspective, the problem is that the Obama Administration kept interest rates near zero for eight years in order to stimulate investment while the federal government borrowed massive amounts of money from abroad in the belief that we could spend our way out of the recession. But the artificially low cost of capital distorted the capital structure of our economy with massive over-investment in the most capital-intensive sectors. The Federal Reserve Bank knew its policy of “quantitative easing” was unsustainable and it was poised to raise interest rates as soon as the economy improved. But with unemployment at historic lows, the Trump administration decided to pour even more money into the capital markets.
We’ve seen this before; in the Austrian school of economics it is known as the over-investment theory of the business cycle. According to this theory, there is a natural structure to investment in the economy based on people saving and investing. Boom-and-bust business cycles are created by temporary injections of funds into the capital markets that lead to over-investment that cannot be sustained in the long-run. Sustainable growth comes from people saving to finance investment — not temporary injections of capital that create the illusion of prosperity.
Is the yield curve signaling that the big boom is about to turn into a big bust? Some financial analysts argue that the yield curve doesn’t apply to our new, technology-driven economy and that there are still many unexploited profitable investments out there. They are urging the Federal Reserve Bank not to raise short-term interest rates, and they will likely blame the Fed if they do raise rates and a recession ensues.
Some may be rooting for a recession for political reasons: an economic downturn would be bad news at the polls for Trump and the Republicans. (The big tax cut was more a Republican idea than Trump’s idea.) I am not among them. We need economic growth to sustain the massive amount of capital investment taking place around the world.
But where are the savers? Much of this investment is financed by debt and more debt. The world is awash in debt.
In my December article for Lagniappe on the 2018 economic outlook, I predicted that the big economic story for the coming year would be inflation, higher interest rates and a declining stock market. This was very much at odds with the picture being painted by the Trump administration. I am not rooting for a recession; I’m just informing my readers of the situation. Google “the inverted yield curve” and decide for yourselves.


Comments are closed.